A self-hosted SIEM (Security Information and Event Management) is a security monitoring platform you install and run on your own servers, virtual machines or private cloud instead of renting it from a vendor. It collects logs from endpoints, servers, firewalls and cloud services, normalizes them, runs detection rules and raises alerts, while all of that data stays on infrastructure you control.
Building a self-hosted SIEM with an open-source platform such as Wazuh gives you centralized log collection, threat detection and file integrity monitoring across your network. You set it up in five phases: prepare the hardware and a Linux server, install the SIEM platform, deploy agents on your endpoints, configure log parsing, file integrity monitoring and detection rules, and then test and tune it.
Which Tools Can You Use For A Self-Hosted SIEM?
You can build a self-hosted SIEM on any open source SIEM such as Wazuh, Security Onion, Elastic Security or OpenSearch. This guide uses Wazuh because it installs the agent, manager, indexer and dashboard together, which makes it the simplest path for a first build.
How To Build A Self-Hosted SIEM Step By Step
Building a self-hosted SIEM takes five phases: hardware and environment, platform install, endpoint agents, log parsing with file integrity monitoring and rules, and finally testing and tuning. The examples below use Wazuh.
Phase 1: Hardware And Environment Requirements
For a home lab or small test environment of up to 25 agents with 90 days of data, Wazuh's official documentation calls for a server like this:
- Hypervisor: VMware Workstation Pro, VirtualBox or Proxmox, or a bare-metal server
- CPU: 4 vCPUs
- RAM: 8 GiB
- Storage: 50 GB, rising to 100 GB for 26 to 50 agents and 200 GB for 51 to 100 agents
- OS: a 64-bit Ubuntu Server LTS release such as 22.04 or 24.04 (Red Hat Enterprise Linux and Amazon Linux are also supported)
Give the VM a static IP address or a bridged network adapter so your endpoints can reach it, and turn on time sync. Then take a snapshot. A clean snapshot turns a broken install into a quick rollback instead of an evening of troubleshooting.
This is a single-node build, with every component on one server. Once your data outgrows one machine, the indexer can be split across a cluster of several nodes.
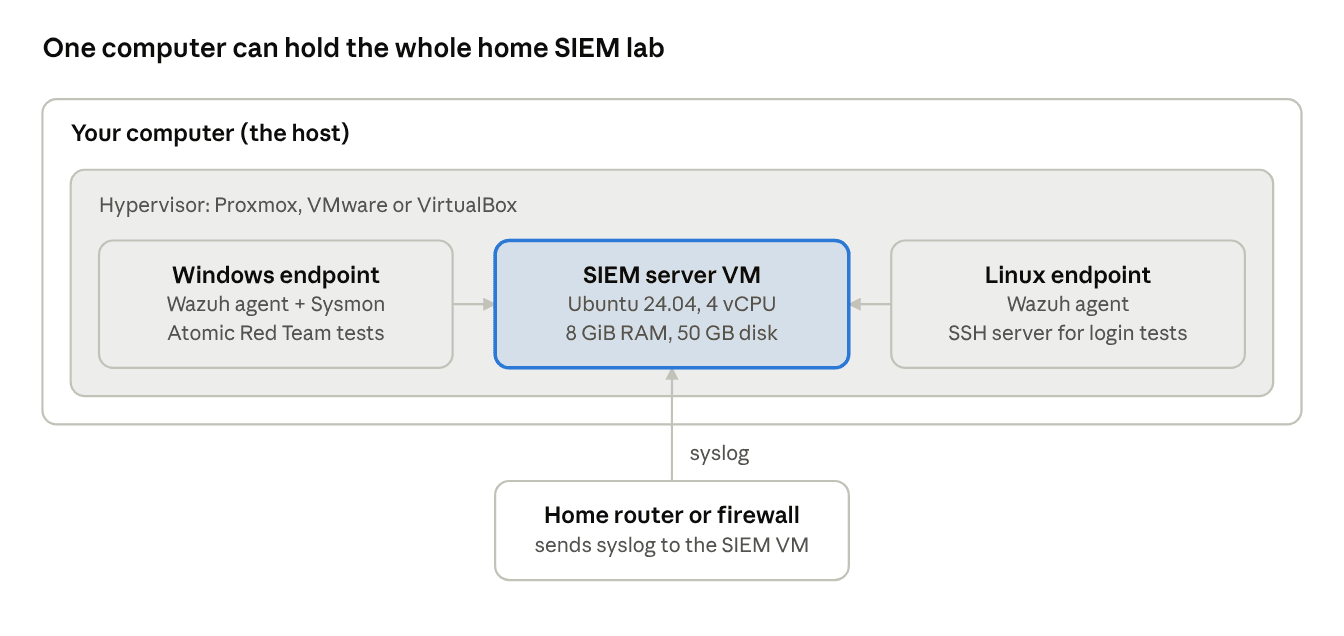
A typical home lab puts the SIEM server between two endpoints on one hypervisor, with the home router sending its logs in from outside.
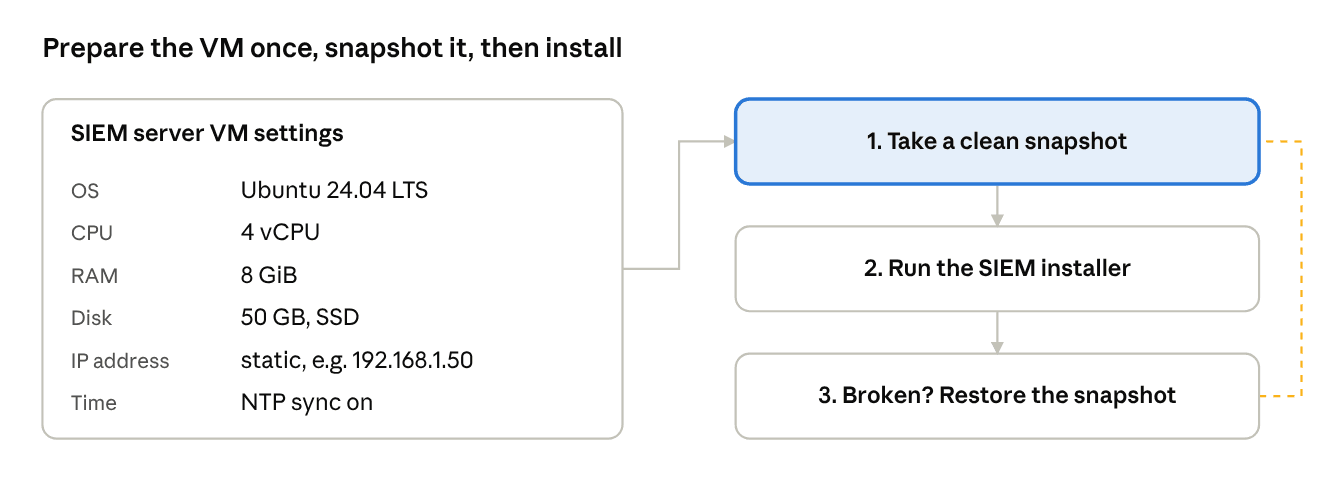
The settings match Wazuh's documented minimum for up to 25 agents; the dashed line is the rollback the snapshot gives you.
Phase 2: Install The SIEM Platform
Wazuh's quickstart installs the manager, indexer and dashboard on one host with a single script. The manager (also called the Wazuh server) receives and analyzes events, the indexer stores them so you can search them, and the dashboard is the web page where you see alerts. On a supported Linux system, the documented command is:
curl -sO https://packages.wazuh.com/4.14/wazuh-install.sh && sudo bash ./wazuh-install.sh -aThe script prints the admin password when it finishes, and all generated passwords are also saved in wazuh-passwords.txt inside the wazuh-install-files.tar archive. Save it, then open https://your-server-ip in a browser and log in with the username admin and that password. Your browser will warn about a self-signed certificate; accept it for now, and replace the certificate before anyone else uses the system.
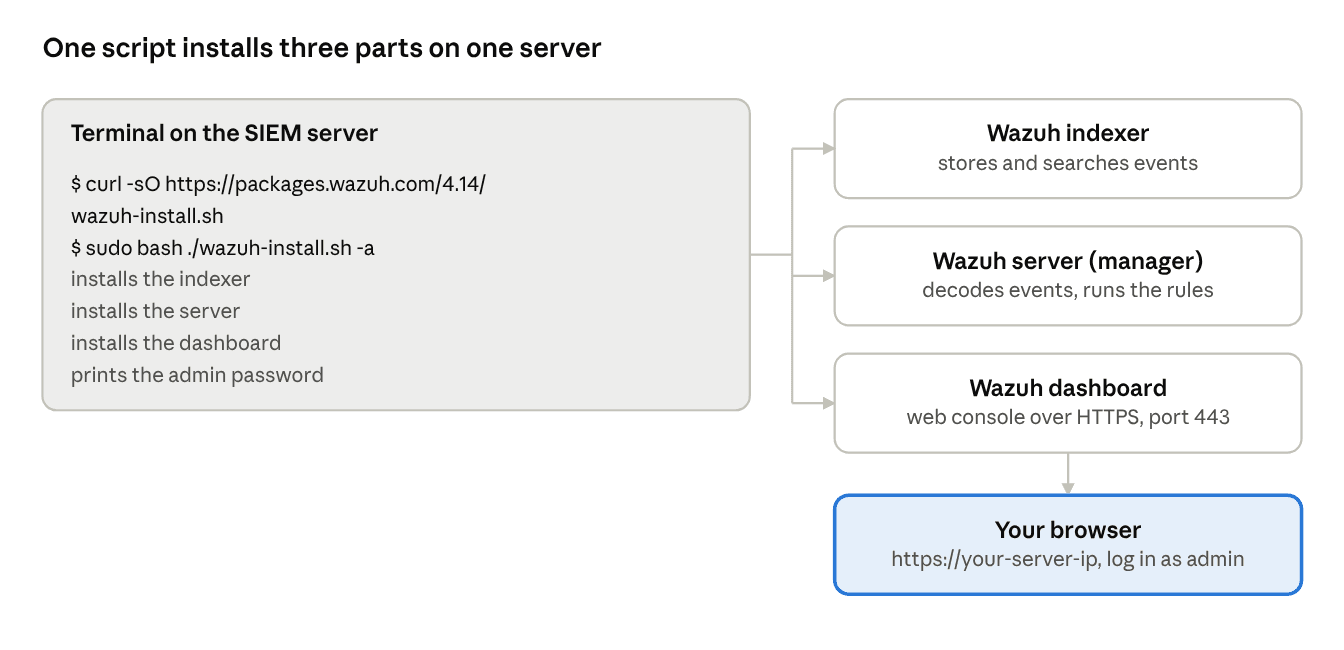
The -a flag puts all three components on the same machine, and you reach the result from any browser on your network.
Phase 3: Deploy Endpoint Agents
A SIEM is only useful once data flows into it, and agents are how endpoints send that data. In the Wazuh dashboard, go to Agents management > Summary and click Deploy new agent. Pick the operating system (Windows, Linux or macOS), enter the server's IP address, and the dashboard generates the exact install and enrollment command for that endpoint.
Run that command on the endpoint, then start the agent service so it begins streaming system logs, authentication events and file changes to the manager:
# Linux (as root)
systemctl daemon-reload
systemctl enable wazuh-agent
systemctl start wazuh-agent

# Windows (Command Prompt as Administrator)
NET START WazuhSvc
On Windows, install Sysmon first. Sysmon is a free Microsoft Sysinternals tool that logs process starts, network connections and file creation in detail. Then add the Sysmon event channel to the agent's configuration, because default Windows logging misses most of what attackers do after they get in.
To do that, open C:\Program Files (x86)\ossec-agent\ossec.conf on the Windows endpoint, add this block inside the ossec_config section, and save the file:
<localfile>
  <location>Microsoft-Windows-Sysmon/Operational</location>
  <log_format>eventchannel</log_format>
</localfile>
Then restart the agent in PowerShell with Restart-Service -Name wazuh, and Sysmon events will start showing up in the dashboard.
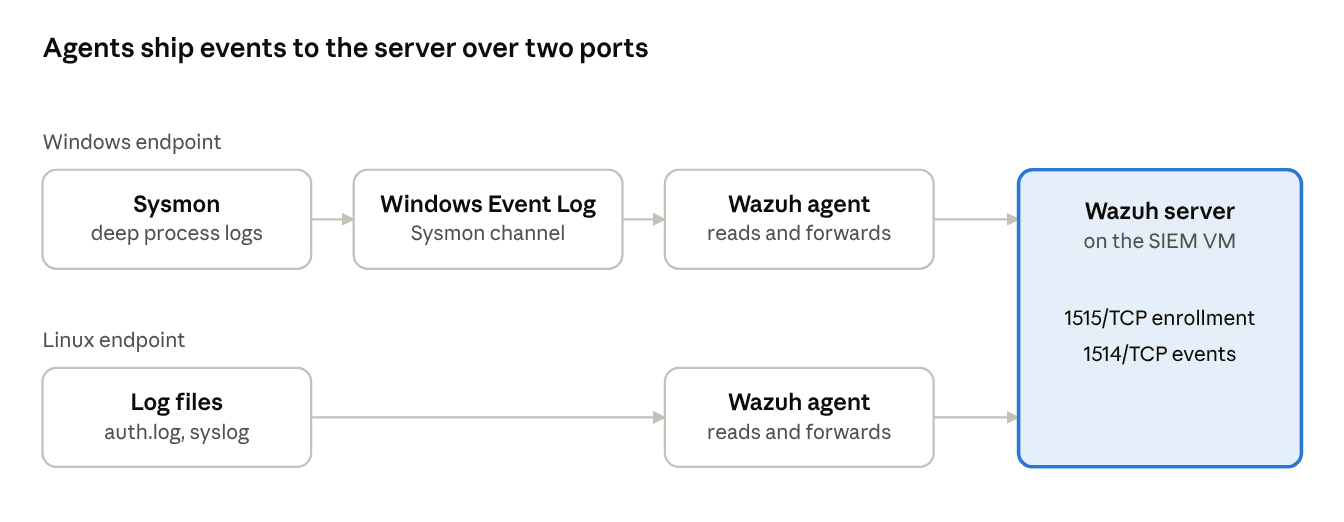
Open TCP ports 1514 and 1515 on the server's firewall, or agents will install fine but never show up as connected.
Phase 4: Configure Log Parsing, FIM And Rules
Phase 4 turns raw logs into alerts you can act on. Decide what you want to catch, bring in every log source that reveals it, switch on file integrity monitoring, check that fields are parsed, and then enable detection rules.
Decide What You Want To Detect
Before you switch on any rules, write down the attacks you care about. Brute-force logins, new admin accounts, malware launched from a user's Downloads folder and changes to critical files are sensible first targets. Each target tells you which log you need, and logs you don't need just cost you disk.
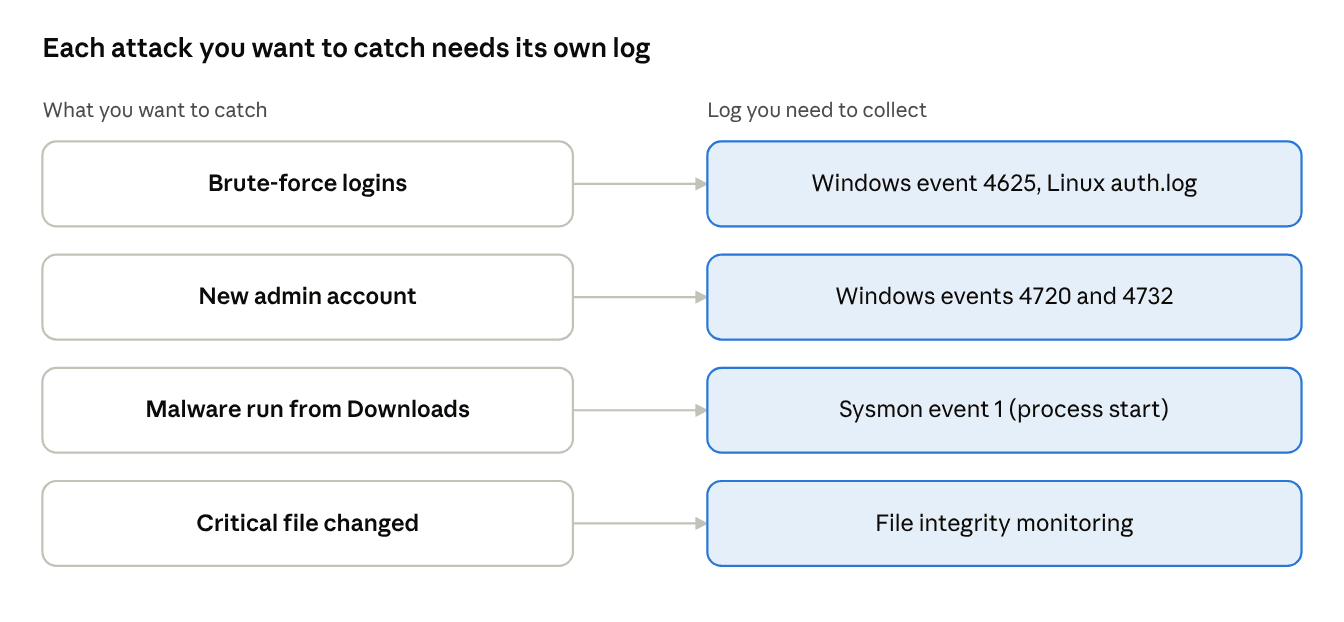
Windows event 4625 is a failed logon, 4720 a new user account and 4732 a user added to a local security group, such as Administrators.
Bring In Network And Firewall Logs
The Wazuh server's syslog listener is turned off by default, so switch it on first. On the server, add this block inside the ossec_config section of /var/ossec/etc/ossec.conf, replacing the two addresses with your firewall's network and your server's own IP:
<remote>
  <connection>syslog</connection>
  <port>514</port>
  <protocol>udp</protocol>
  <allowed-ips>192.168.1.0/24</allowed-ips>
  <local_ip>192.168.1.50</local_ip>
</remote>
The allowed-ips line is mandatory; without it the setting doesn't take effect. Use tcp instead of udp if your firewall sends syslog over TCP. Then restart the manager with systemctl restart wazuh-manager.
Configure your firewall or router to send syslog (the standard way network devices ship their logs) to the SIEM server, then confirm the events arrive and parse into named fields rather than one long text string. Optional for a first build: if you want network intrusion alerts, run Suricata (an engine that inspects network traffic for attacks) on a machine connected to a mirrored switch port, then install a Wazuh agent on that machine and add this block to its /var/ossec/etc/ossec.conf file so it reads Suricata's alert log:
<localfile>
  <log_format>json</log_format>
  <location>/var/log/suricata/eve.json</location>
</localfile>
Restart the agent, and Wazuh parses Suricata's alerts automatically.
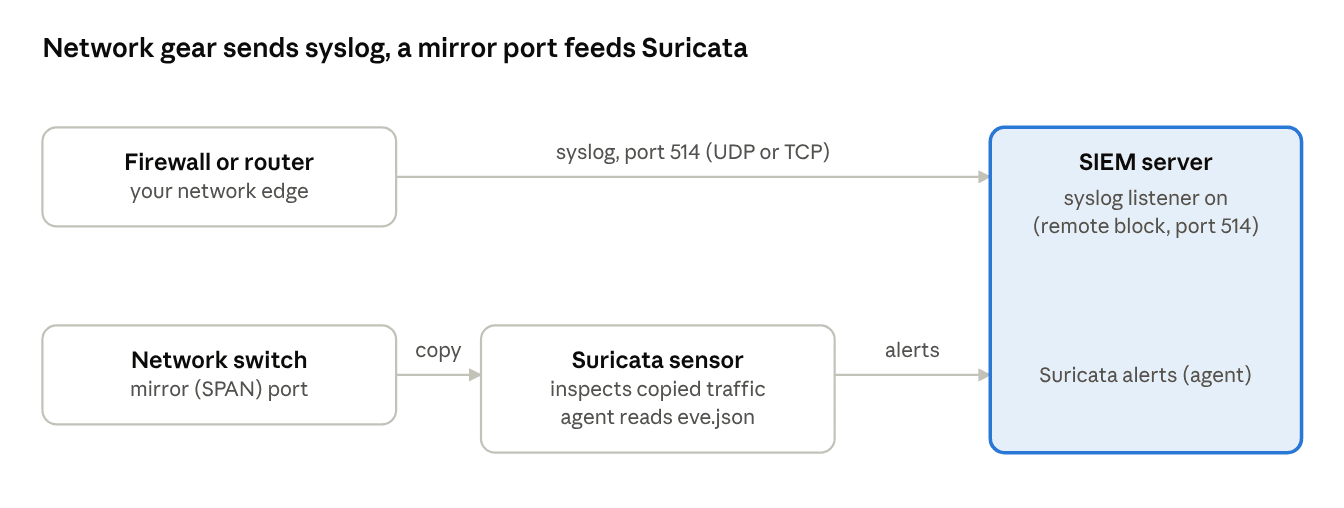
The firewall talks to the SIEM directly over syslog; Suricata only sees a copy of the traffic, so it can't slow your network down.
Turn On File Integrity Monitoring
File integrity monitoring (FIM) alerts you when a watched file is created, changed or deleted. In Wazuh the FIM module is called syscheck, and you set it in the agent's ossec.conf file (/var/ossec/etc/ossec.conf on Linux, C:\Program Files (x86)\ossec-agent\ossec.conf on Windows). To watch key Linux system folders in real time, add:
<syscheck>
  <directories realtime="yes">/etc,/usr/bin,/usr/sbin</directories>
</syscheck>
On Windows, Wazuh's default configuration already watches key system folders such as C:\Windows\System32\drivers\etc. To add your own, use the same syntax with a Windows path, for example C:\Users\*\Downloads to watch every user's Downloads folder. Each watched folder must exist before you restart the agent, and you need to restart the agent after every change to ossec.conf so the new settings load.
Check That Fields Are Parsed
Wazuh decoders, small parsing rules that know how to read each log format, pull fields such as srcip, srcuser and action out of each log line, which is what lets one rule work across many log sources. Open a few events from each source in the dashboard and confirm those fields are filled. A log that shows only one long full_log string needs a custom decoder before rules can use it.
Enable Detection Rules And Map Them To MITRE ATT&CK
Enable the built-in rule sets, then open Threat intelligence > MITRE ATT&CK in the dashboard to see which techniques your current logs can cover. Gaps usually point to a missing log source, not a missing rule. If nothing covers credential theft, for example, you probably aren't collecting the right Windows process events yet.
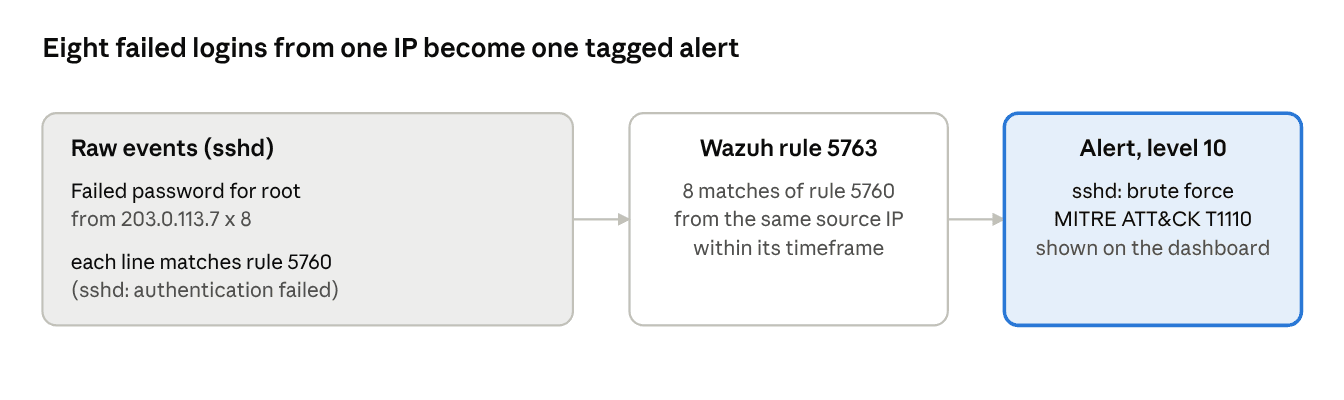
Eight failed-login lines mean little on their own. Wazuh's built-in rule 5763 counts them per source IP and raises one level 10 alert tagged with MITRE ATT&CK T1110 (Brute Force), so the analyst knows what to look at first.
If you want longer log pipelines or custom dashboards later, Graylog or Grafana can run alongside Wazuh, but neither is needed for a first build.
Phase 5: Test, Tune And Lock It Down
A SIEM that has never caught a test attack is a guess. This phase proves your rules fire, cuts the noise and secures the server itself.
Run Simulated Attacks
Run a few tests from Atomic Red Team, an open library of small attack simulations mapped to MITRE ATT&CK, on your test machine, one technique at a time. Then try eight or more failed SSH logins from one machine against your Linux endpoint; Wazuh's rule 5763 should fire. Every test that doesn't produce an alert is a detection gap you've found before a real attacker does.
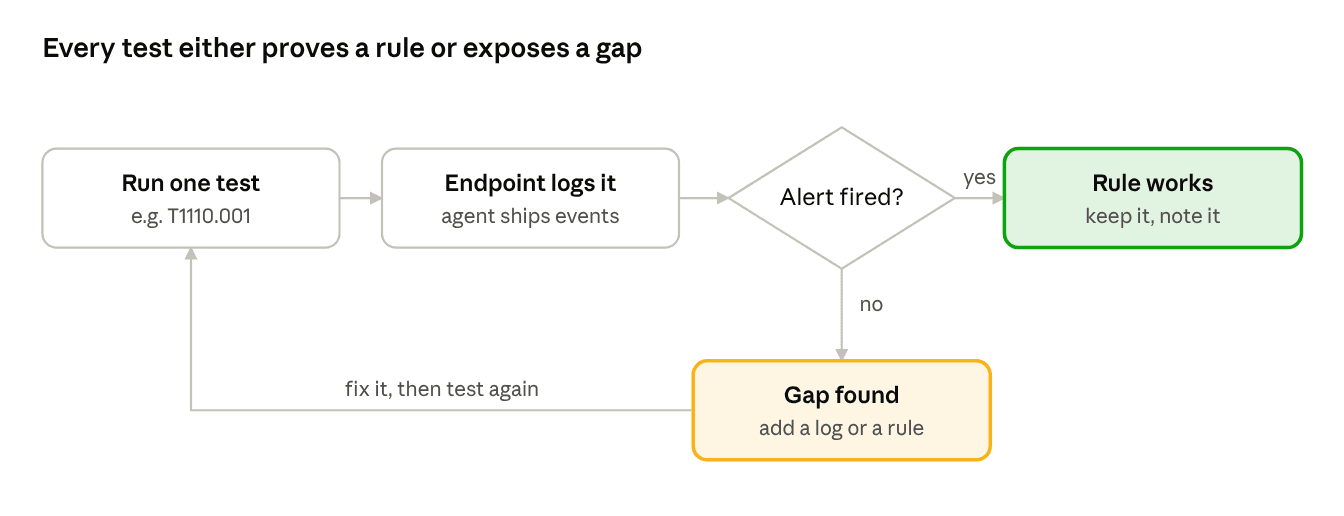
T1110.001 is the ATT&CK ID for password guessing; repeat the loop for each technique on your detection list until every one ends in a working rule.
Tune Alerts, Set Retention And Harden The Server
Expect noise in the first week. Lower the level of rules that fire on normal admin activity instead of deleting them, so you keep the record. Create an Index State Management (ISM) retention policy under Indexer management > Index Management, a rule that deletes old indices automatically once they pass the age you set, back up your configuration and custom rules, replace the self-signed certificate, change default passwords and limit dashboard access to your own network or a VPN.
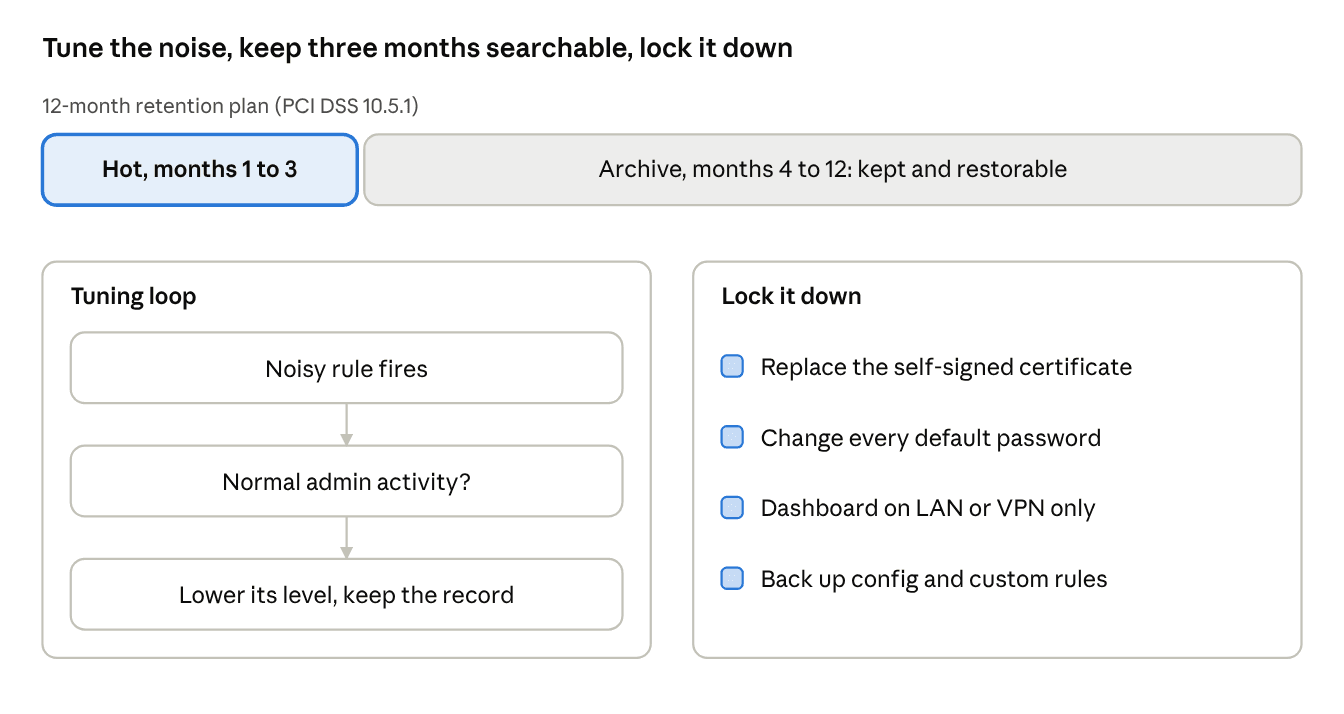
Hot data sits in the searchable index; archived data is stored more cheaply and restored when you need it. The three-month and twelve-month split comes from PCI DSS 10.5.1, the payment card security standard. If no regulation applies to you, keep as much hot data as you realistically need for investigations. Retention is also the main reason storage keeps growing, so it shapes what a SIEM costs over time.
As the build grows, match it to what you plan to monitor: Windows and Linux endpoints need agents, firewalls and switches need syslog, and cloud services need their audit logs pulled in. Once the core detections work, teams often add Velociraptor for endpoint forensics and Shuffle for SOAR (security orchestration, automation and response), which runs response steps automatically when an alert fires.
How Does A Self-Hosted SIEM Work?
Like any SIEM, a self-hosted SIEM works as a pipeline: agents and log shippers collect events, a server parses and normalizes them, an indexer stores them, a rules engine checks them for attack patterns, and a dashboard shows the resulting alerts to an analyst. Every stage runs on hardware you manage.
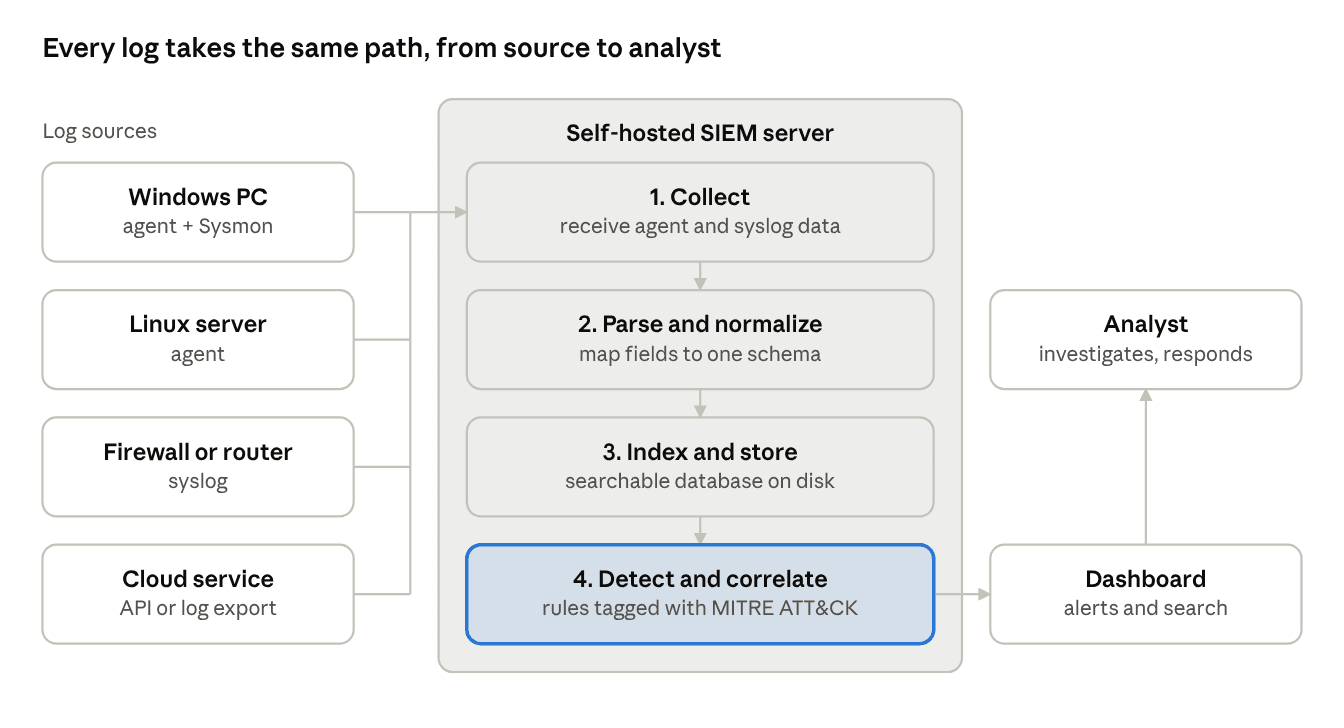
Every source feeds the same four stages on your server, and only the detection stage turns raw logs into alerts an analyst sees.
Collection
Small programs called agents sit on each monitored machine and forward its logs: Windows event logs, Linux authentication logs, file changes and running processes. Network devices such as firewalls can't run an agent, so they send logs over syslog, the standard protocol for shipping log lines across a network.
Parsing And Normalization
Raw logs arrive in dozens of formats. The SIEM parses each one with a decoder, then normalizes it, which means mapping the fields into one shared schema. That way "source IP" means the same thing whether it came from a firewall or a Windows server, and one rule can work across every log source.
Storage And Indexing
Normalized events are written to an indexer, a search database (usually built on OpenSearch or Elasticsearch) that makes huge volumes of records searchable in seconds. This is the part that eats disk space, so it's the part you size most carefully.
Detection And Correlation
A rules engine compares incoming events against detection rules. Some rules match a single event, like a new local admin account. Correlation rules link several events, such as eight failed logins from the same address within a short time. Good platforms tag each rule with a technique from MITRE ATT&CK, a public catalog of real attacker behavior.
Alerting And Investigation
When a rule fires, the SIEM creates an alert with a severity level and shows it on a dashboard. An analyst opens the alert, looks at the surrounding logs and decides whether it's a real incident. Some platforms can also run an automatic response, such as blocking an IP address on the affected host.
Final Thoughts
Building a self-hosted SIEM is very doable. A single Linux server and a few agents will get you real alerts. The install is the easy part, though.
What makes a SIEM useful is everything after it: the right log sources, rules tested against real techniques, retention planned around your requirements, and a person who reads the alerts every day. Start small, prove each detection works, and grow the build only as fast as you can keep it tuned.
Frequently Asked Questions About Self-Hosted SIEM
Yes. You can build your own SIEM by installing a platform such as Wazuh on a 64-bit Linux server or virtual machine, enrolling agents on the machines you want to monitor, and turning on detection rules. A basic single-server setup is realistic for one person with Linux skills.
Yes. Wazuh publishes official Docker images with two ready-made stacks: a single-node stack with one indexer, manager and dashboard container, and a multi-node stack for clusters. Wazuh's Docker documentation asks for at least 8 GB of RAM on the host for the single-node stack and 16 GB for the multi-node stack, and you must raise the host's vm.max_map_count setting to 262144. Agents are still installed on each endpoint the same way.